Monterey County, California
Monterey County | ||
|---|---|---|
County | ||
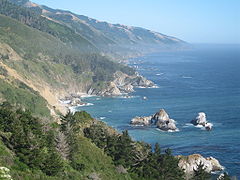
  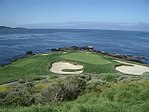 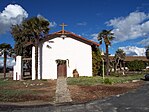  Images, from top down, left to right: Monterey Bay Aquarium, Main Street in Salinas, the seventh hole at Pebble Beach Golf Links, Mission Soledad, Big Sur Coastline | ||
| ||
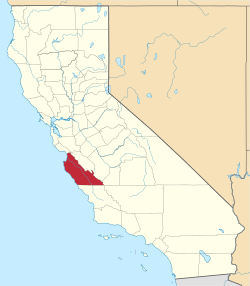 Location in the state of California | ||
| Country | ||
| State | ||
| Region | California Central Coast | |
| Incorporated | February 18, 1850[1] | |
| Named for | Monterey Bay, which is named from a Spanish portmanteau of monte ("hill") and rey ("king") | |
| County seat | Salinas | |
| Largest city | Salinas | |
| Area | ||
| • Total | 3,771 sq mi (9,770 km2) | |
| • Land | 3,281 sq mi (8,500 km2) | |
| • Water | 491 sq mi (1,270 km2) | |
| Highest elevation [2] | 5,865 ft (1,788 m) | |
| Population (April 1, 2010)[3] | ||
| • Total | 415,057 | |
| • Estimate (2016)[4] | 435,232 | |
| • Density | 110/sq mi (42/km2) | |
| Time zone | UTC-8 (Pacific Time Zone) | |
| • Summer (DST) | UTC-7 (Pacific Daylight Time) | |
| Area codes | 805, 831 | |
| Primary Airport | Monterey Regional Airport MRY (Major/Regional) | |
| U.S. Routes | ||
| State Routes | ||
| County Routes | ||
| Commuter Rail | ||
| Website | www.co.monterey.ca.us | |

Monterey County, officially the County of Monterey, is a county located on the Pacific coast of the U.S. state of California. As of the 2010 census, the population was 415,057.[5] The county seat and largest city is Salinas.[6]
Monterey County comprises the Salinas, CA Metropolitan Statistical Area. It borders the Monterey Bay, from which it derives its name. The northern half of the bay is in Santa Cruz County. Monterey County is a member of the regional governmental agency, Association of Monterey Bay Area Governments.
The coastline, including Big Sur, State Route 1, and the 17 Mile Drive on the Monterey Peninsula, has made the county world-famous. The city of Monterey was the capital of California under Spanish and Mexican rule. The economy is primarily based upon tourism in the coastal regions and agriculture in the Salinas River valley. Most of the county's people live near the northern coast and Salinas Valley, while the southern coast and inland mountain regions are sparsely populated.
Contents
1 History
2 Geography
2.1 Adjacent counties
2.2 National protected areas
2.3 Marine protected areas
2.4 Flora and fauna
3 Demographics
3.1 Income, education and poverty 2013
3.1.1 Most affluent neighborhoods
3.1.2 Least affluent neighborhoods
3.2 2011
3.2.1 Places by population, race, and income
3.3 2010
3.4 2000
4 Government
4.1 Supervisorial Districts
4.1.1 District 1
4.1.2 District 2
4.1.3 District 3
4.1.4 District 4
4.1.5 District 5
4.2 State and federal Representatives
5 Politics
5.1 Voter registration
5.1.1 Cities by population and voter registration
5.2 Overview
6 Crime
6.1 Cities by population and crime rates
7 Media
8 Home prices
9 Transportation
9.1 Major highways
9.2 Public transportation
9.3 Airports
10 Communities
10.1 Cities
10.2 Census-designated places
10.3 Unincorporated communities
10.4 Other places
10.5 Population ranking
11 Gallery
12 See also
13 Notes
14 References
15 External links
History
Monterey County was one of the original counties of California, created in 1850 at the time of statehood. Parts of the county were given to San Benito County in 1874. The area was originally populated by Ohlone, Salinan and Esselen tribes.
The county derives its name from Monterey Bay. The bay was named by Sebastián Vizcaíno in 1602 in honor of the Conde de Monterrey (or Count of Monterrey), then the Viceroy of New Spain.[7] Monterrey is a variation of Monterrei, a municipality in the Galicia region of Spain where the Conde de Monterrey and his father (the Fourth Count of Monterrei) were from.
Geography
According to the U.S. Census Bureau, the county has a total area of 3,771 square miles (9,770 km2), of which 3,281 square miles (8,500 km2) is land and 491 square miles (1,270 km2) (13%) is water.[8] The county is roughly 1.5 times larger than the state of Delaware, and roughly similar in population and size to Santa Barbara County.
Adjacent counties

National protected areas
Los Padres National Forest (part)
Pinnacles National Park (part)- Salinas River National Wildlife Refuge
Ventana Wilderness (part)
Marine protected areas
- Soquel Canyon State Marine Conservation Area
- Elkhorn Slough State Marine Reserve
- Elkhorn Slough State Marine Conservation Area
- Moro Cojo Slough State Marine Reserve
- Portuguese Ledge State Marine Conservation Area
- Pacific Grove Marine Gardens State Marine Conservation Area
- Lovers Point State Marine Reserve
- Edward F. Ricketts State Marine Conservation Area
- Asilomar State Marine Reserve
Flora and fauna
Monterey County has habitat to support the following endangered species:
- Hickman's potentilla
- Santa Cruz Long-toed Salamander
- Santa Cruz Tarweed
- Southern Steelhead Trout
- Yadon's piperia
Demographics
Income, education and poverty 2013

Median Household Income across the populated northern half of Monterey County, as of 2014.

Percent of affluent households (i.e. $150k annual income or higher) across census tracts in most populated area of the county.[9]
Generally, the western/southern parts of the Monterey Peninsula, Carmel Valley, Creekbridge (Salinas), and eastern parts of Prundale were the county's most affluent and educated (see dark blue on map). These areas had a median household income significantly above that of the California or the U.S. overall (typically above $95,000 vs. $60,000 for California and $52,000 for the U.S.)[10] and comprised roughly 8%-10% of neighborhoods (as defined by Census Block Groups).[11] Educational attainment was at least on part with, or above, state and national levels,[12] in these areas while the percentage of people living in poverty was typically a third or less than national and statewide average (with the exception of South Salinas).[13]
Social deprivation (poverty and low levels of educational attainment) was concentrated in the central and eastern parts of Salinas, and central areas of Monterey, Seaside, Marina, Soledad and King City. In central and eastern Salinas up to 46% of individuals lived below the poverty line and those without a secondary educations formed a plurality or majority of residents.[12][13] Overall, the Salinas metropolitan area, defined as coterminous with Monterey County, was among the least educated urban areas in the nation.
Most affluent neighborhoods
Roughly 8% of neighborhoods, as defined by Census Block Groups, had a median household income above $100,000 per year, about 60% above the national median. This coincided with the top 20 census block groups in the county listed below.[10][11]
Most affluent neighborhoods (Median Household Income above $100k/yr.)[11][14]
| Rank | neighborhood | Census Reference/Geo-Unit | Median Household Income |
|---|---|---|---|
| 1 | Carmel Valley (North-West) | Block Group 1, Census Tract 116.02 | $152,411 |
| 2 | Mount Toro Foothills, Salinas Valley | Block Group 3, Census Tract 107.01 | $143,508 |
| 3 | Jacks Peak, Monterey | Block Group 1, Census Tract 132 | $142,143 |
| 4 | Mount Toro Foothills, Salinas Valley | Block Group 2, Census Tract 107.02 | $141,364 |
| 5 | Skyline Forest, Monterey | Block Group 3, Census Tract 128 | $130,221 |
| 6 | Yankee Point, Carmel | Block Group 3, Census Tract 117 | $126,389 |
| 7 | Carmel Valley (North-West) | Block Group 3, Census Tract 116.02 | $122,056 |
| 8 | Carmel Valley (North-West) | Block Group 4, Census Tract 116.02 | $118,159 |
| 9 | Carmel Valley (North-West) | Block Group 2, Census Tract 110 | $118,125 |
| 10 | Carmel Valley (North-West) | Block Group 4, Census Tract 110 | $115,667 |
| 11 | Carmel (East, outside of city limits) | Block Group 2, Census Tract 117 | $115,357 |
| 12 | Jacks Peak, Monterey | Block Group 2, Census Tract 132 | $113,750 |
| 13 | Skyline Forest, Monterey | Block Group 5, Census Tract 128 | $111,500 |
| 14 | City of Carmel (Southern half) | Block Group 1, Census Tract 118.02 | $110,962 |
| 15 | Las Palmas, Salinas Valley | Block Group 2, Census Tract 107.01 | $110,918 |
| 16 | Pebble Beach, Monterey Peninsula Country Club | Block Group 4, Census Tract 119 | $107,500 |
| 17 | Mount Toro Foothills, Salinas Valley | Block Group 1, Census Tract 107.02 | $105,511 |
| 18 | Carmel Valley (North-West) | Block Group 1, Census Tract 116.04 | $104,902 |
| 19 | City of Carmel (Northern half) | Block Group 2, Census Tract 118.01 | $101,984 |
| 20 | Creekbridge (incl. Falcon Meadows), Salinas | Block Group 2, Census Tract 106.03 | $100,673 |
| 141* | United States | N/A | $53,046 |
| 104* | California | N/A | $61,094 |
| 154* | City of Salinas | N/A | $49,264 |
* Asterisk denotes a hypothetical rank among Monterey County's 226 Census Block Groups (e.g. if the U.S. overall was a Census Block Group in Monterey County, it would be the 141st most affluent of 226).
Least affluent neighborhoods
About 4.5% of neighborhoods, as defined by Census Block Groups, had a median household income below $30,000 per year, about 60% below the national median. This coincided with the 10 poorest of the 20 lowest income neighborhoods listed in the table below.[10][11]
Least affluent neighborhoods (Median Household Income of $34.1k or less)[11][14]
| Rank | neighborhood | Census Reference/Geo-Unit | Median Household Income |
|---|---|---|---|
| 1 | Downtown Salinas | Block Group 1, Census Tract 13 | $21,411 |
| 2 | Central Seaside | Block Group 3, Census Tract 137 | $22,994 |
| 3 | East Salinas (Del Monte Ave.) | Block Group 1, Census Tract 7.01 | $23,250 |
| 4 | Downtown Monterey | Block Group 1, Census Tract 127 | $24,911 |
| 5 | Central Marina (Del Monte Blvd.) | Block Group 3, Census Tract 142.01 | $25,464 |
| 6 | Hebbron Heights, East Salinas | Block Group 2, Census Tract 5.01 | $26,211 |
| 7 | East Salinas (Del Monte Ave.) | Block Group 3, Census Tract 7.01 | $26,771 |
| 8 | East Salinas (Del Monte Ave.) | Block Group 2, Census Tract 7.02 | $26,875 |
| 9 | Hebbron Heights, East Salinas | Block Group 1, Census Tract 5.01 | $28,750 |
| 10 | Downtown Monterey | Block Group 2, Census Tract 127 | $29,070 |
| 11 | West Santa Rita, Salinas | Block Group 1, Census Tract 105.06 | $30,250 |
| 12 | North-Central Salinas/Chinatown | Block Group 2, Census Tract 18.02 | $30,625 |
| 13 | Central King City | Block Group 2, Census Tract 113.02 | $31,579 |
| 14 | Central King City | Block Group 1, Census Tract 113.02 | $33,043 |
| 15 | Central Soledad | Block Group 3, Census Tract 111.01 | $33,110 |
| 16 | East Seaside | Block Group 1, Census Tract 135 | $33,242 |
| 17 | East Salinas (Del Monte Ave.) | Block Group 3, Census Tract 7.02 | $33,244 |
| 18 | East Soledad | Block Group 1, Census Tract 111.02 | $33,616 |
| 19 | East Salinas | Block Group 3, Census Tract 8 | $33,938 |
| 20 | North Salinas (E. Bernal Drive./Natividad Rd.) | Block Group 3, Census Tract 4 | $34,057 |
| 86* | United States | N/A | $53,046 |
| 118* | California | N/A | $61,094 |
| 73* | City of Salinas | N/A | $49,264 |
* Asterisk denotes a hypothetical rank among Monterey County's 226 Census Block Groups (e.g. if the U.S. overall was a Census Block Group in Monterey County, it would be the 86th poorest of 226).
2011

Thematic map showing percentage of households speaking only English at home.
| Population, race, and income | |||||
|---|---|---|---|---|---|
| Total population[15] | 411,385 | ||||
| White[15] | 296,264 | 72.0% | |||
| Black or African American[15] | 12,848 | 3.1% | |||
| American Indian or Alaska Native[15] | 3,826 | 0.9% | |||
| Asian[15] | 25,419 | 6.2% | |||
| Native Hawaiian or other Pacific Islander[15] | 1,941 | 0.5% | |||
| Some other race[15] | 56,356 | 13.7% | |||
| Two or more races[15] | 14,731 | 3.6% | |||
| Hispanic or Latino (of any race)[16] | 224,435 | 54.6% | |||
| Per capita income[17] | $25,508 | ||||
| Median household income[18] | $59,737 | ||||
| Median family income[19] | $63,523 | ||||
Places by population, race, and income
| Places by population and race | ||||||||
|---|---|---|---|---|---|---|---|---|
| Place | Type[20] | Population[15] | White[15] | Other[15] [note 1] | Asian[15] | Black or African American[15] | Native American[15] [note 2] | Hispanic or Latino (of any race)[16] |
Aromas ‡ | CDP | 1,357 | 87.0% | 3.9% | 9.1% | 0.0% | 0.0% | 28.2% |
| Boronda | CDP | 1,606 | 58.0% | 31.2% | 9.9% | 0.0% | 0.9% | 82.6% |
| Bradley | CDP | 75 | 74.7% | 20.0% | 0.0% | 5.3% | 0.0% | 2.7% |
| Carmel-by-the-Sea | City | 3,728 | 90.0% | 3.6% | 6.4% | 0.0% | 0.0% | 8.1% |
| Carmel Valley Village | CDP | 4,676 | 88.6% | 9.2% | 2.2% | 0.0% | 0.0% | 6.8% |
| Castroville | CDP | 5,809 | 61.9% | 31.0% | 2.5% | 0.0% | 4.6% | 94.5% |
| Chualar | CDP | 1,182 | 83.0% | 13.4% | 1.6% | 0.9% | 1.1% | 92.0% |
| Del Monte Forest | CDP | 4,312 | 82.1% | 1.9% | 15.2% | 0.0% | 0.7% | 2.7% |
| Del Rey Oaks | City | 1,734 | 87.1% | 8.2% | 3.4% | 1.3% | 0.0% | 16.3% |
| Elkhorn | CDP | 1,828 | 90.9% | 7.1% | 2.0% | 0.0% | 0.0% | 30.1% |
| Gonzales | City | 8,074 | 79.9% | 17.9% | 0.8% | 1.4% | 0.0% | 89.4% |
| Greenfield | City | 15,864 | 66.4% | 21.3% | 4.2% | 1.0% | 7.1% | 87.9% |
| King City | City | 12,629 | 74.6% | 22.8% | 1.5% | 0.8% | 0.3% | 87.2% |
| Las Lomas | CDP | 2,820 | 84.8% | 15.2% | 0.0% | 0.0% | 0.0% | 89.3% |
| Lockwood | CDP | 255 | 96.1% | 0.0% | 0.0% | 3.9% | 0.0% | 14.1% |
| Marina | City | 19,636 | 44.8% | 17.9% | 5.5% | 28.6% | 3.2% | 29.5% |
| Monterey | City | 27,861 | 76.4% | 10.5% | 10.0% | 2.6% | 0.6% | 14.7% |
| Moss Landing | CDP | 232 | 95.3% | 4.7% | 0.0% | 0.0% | 0.0% | 52.6% |
| Pacific Grove | City | 14,995 | 85.7% | 5.3% | 6.5% | 1.7% | 0.8% | 7.9% |
| Pajaro | CDP | 2,939 | 88.5% | 8.4% | 2.4% | 0.5% | 0.1% | 95.1% |
| Pine Canyon | CDP | 2,235 | 70.8% | 18.8% | 0.0% | 0.0% | 10.3% | 50.5% |
| Prunedale | CDP | 18,938 | 80.0% | 11.7% | 5.5% | 1.3% | 1.4% | 41.4% |
| Salinas | City | 148,780 | 68.6% | 22.7% | 6.4% | 1.7% | 0.6% | 75.1% |
| San Ardo | CDP | 591 | 66.7% | 32.5% | 0.0% | 0.0% | 0.8% | 85.3% |
| Sand City | City | 292 | 75.7% | 19.5% | 2.4% | 2.4% | 0.0% | 38.4% |
| San Lucas | CDP | 242 | 69.4% | 26.4% | 0.0% | 4.1% | 0.0% | 96.3% |
| Seaside | City | 32,735 | 58.9% | 20.8% | 8.5% | 9.1% | 2.7% | 40.3% |
| Soledad | City | 25,548 | 66.6% | 17.0% | 2.7% | 12.0% | 1.7% | 69.4% |
| Spreckels | CDP | 803 | 87.9% | 9.7% | 0.0% | 1.5% | 0.9% | 14.3% |
| ‡ Data for Monterey County area of this CDP | ||||||||
| Places by population and income | |||||
|---|---|---|---|---|---|
| Place | Type[20] | Population[21] | Per capita income[17] | Median household income[18] | Median family income[19] |
Aromas ‡ | CDP | 1,357 | $28,115 | $75,750 | $90,729 |
| Boronda | CDP | 1,606 | $12,288 | $39,899 | $49,405 |
| Bradley | CDP | 75 | $29,332 | $75,625 | $75,625 |
| Carmel-by-the-Sea | City | 3,728 | $56,172 | $76,463 | $98,889 |
| Carmel Valley Village | CDP | 4,676 | $48,272 | $82,566 | $106,545 |
| Castroville | CDP | 5,809 | $12,836 | $46,795 | $41,250 |
| Chualar | CDP | 1,182 | $13,492 | $48,654 | $48,269 |
| Del Monte Forest | CDP | 4,312 | $79,282 | $119,663 | $133,103 |
| Del Rey Oaks | City | 1,734 | $37,814 | $76,923 | $101,087 |
| Elkhorn | CDP | 1,828 | $26,959 | $78,750 | $75,288 |
| Gonzales | City | 8,074 | $17,545 | $52,928 | $50,324 |
| Greenfield | City | 15,864 | $14,921 | $56,011 | $51,250 |
| King City | City | 16,360 | $14,337 | $52,634 | $49,735 |
| Las Lomas | CDP | 2,820 | $11,861 | $49,750 | $49,208 |
| Lockwood | CDP | 255 | $51,739 | $91,316 | $76,923 |
| Marina | City | 19,636 | $23,976 | $51,817 | $63,778 |
| Monterey | City | 27,861 | $36,148 | $62,720 | $73,685 |
| Moss Landing | CDP | 232 | $25,884 | $80,385 | $81,635 |
| Pacific Grove | City | 14,995 | $43,319 | $70,211 | $89,708 |
| Pajaro | CDP | 2,939 | $10,873 | $38,542 | $41,313 |
| Pine Canyon | CDP | 2,235 | $20,909 | $61,514 | $62,163 |
| Prunedale | CDP | 18,938 | $29,157 | $76,431 | $80,208 |
| Salinas | City | 148,780 | $18,060 | $50,568 | $50,945 |
| San Ardo | CDP | 591 | $11,615 | $49,063 | $50,313 |
| Sand City | City | 292 | $30,061 | $39,500 | $78,750 |
| San Lucas | CDP | 242 | $12,548 | $49,250 | $51,250 |
| Seaside | City | 32,735 | $22,262 | $58,403 | $62,520 |
| Soledad | City | 25,548 | $9,971 | $53,140 | $53,660 |
| Spreckels | CDP | 803 | $32,730 | $73,287 | $96,250 |
| ‡ Data for Monterey County area of this CDP | |||||
2010
| Historical population | |||
|---|---|---|---|
| Census | Pop. | %± | |
| 1850 | 1,872 | — | |
| 1860 | 4,739 | 153.2% | |
| 1870 | 9,876 | 108.4% | |
| 1880 | 11,302 | 14.4% | |
| 1890 | 18,637 | 64.9% | |
| 1900 | 19,380 | 4.0% | |
| 1910 | 24,146 | 24.6% | |
| 1920 | 27,980 | 15.9% | |
| 1930 | 53,705 | 91.9% | |
| 1940 | 73,032 | 36.0% | |
| 1950 | 130,498 | 78.7% | |
| 1960 | 198,351 | 52.0% | |
| 1970 | 250,071 | 26.1% | |
| 1980 | 290,444 | 16.1% | |
| 1990 | 355,660 | 22.5% | |
| 2000 | 401,762 | 13.0% | |
| 2010 | 415,057 | 3.3% | |
| Est. 2017 | 437,907 | [4] | 5.5% |
| U.S. Decennial Census[22] 1790–1960[23] 1900–1990[24] 1990–2000[25] 2010–2015[5] | |||
The 2010 United States Census reported that Monterey County had a population of 415,057. The racial makeup of Monterey County was 230,717 (55.6%) White, 12,785 (3.1%) African American, 5,464 (1.3%) Native American, 25,258 (6.1%) Asian (2.8% Filipino, 0.7% Korean, 0.6% Chinese, 0.6% Japanese, 0.4% Vietnamese, 0.4% Indian), 2,071 (0.5%) Pacific Islander, 117,405 (28.3%) from other races, and 21,357 (5.1%) from two or more races. Hispanic or Latino of any race were 230,003 persons (55.4%); 50.2% of Monterey County is Mexican, 0.8% Salvadoran, and 0.5% Puerto Rican.[26]
| Population reported at 2010 United States Census | |||||||||
|---|---|---|---|---|---|---|---|---|---|
| The County | Total Population | White | African American | Native American | Asian | Pacific Islander | other races | two or more races | Hispanic or Latino (of any race) |
Monterey County | 415,057 | 230,717 | 12,785 | 5,464 | 25,258 | 2,071 | 117,405 | 21,357 | 230,003 |
| Incorporated city | Total Population | White | African American | Native American | Asian | Pacific Islander | other races | two or more races | Hispanic or Latino (of any race) |
Carmel-by-the-Sea | 3,722 | 3,464 | 11 | 8 | 111 | 6 | 45 | 77 | 174 |
Del Rey Oaks | 1,624 | 1,326 | 16 | 12 | 128 | 4 | 52 | 86 | 169 |
Gonzales | 8,187 | 3,464 | 81 | 124 | 190 | 14 | 3,958 | 356 | 7,276 |
Greenfield | 16,330 | 5,976 | 183 | 878 | 179 | 13 | 8,453 | 648 | 14,917 |
King City | 12,874 | 6,173 | 150 | 347 | 172 | 8 | 5,451 | 573 | 11,266 |
Marina | 19,718 | 8,904 | 1,487 | 140 | 3,931 | 544 | 2,738 | 1,974 | 5,372 |
Monterey | 27,810 | 21,788 | 777 | 149 | 2,204 | 91 | 1,382 | 1,419 | 3,817 |
Pacific Grove | 15,041 | 12,710 | 199 | 78 | 872 | 49 | 469 | 664 | 1,615 |
Salinas | 150,441 | 68,973 | 2,993 | 1,888 | 9,438 | 478 | 59,041 | 7,630 | 112,799 |
Sand City | 334 | 223 | 13 | 3 | 16 | 1 | 61 | 17 | 123 |
Seaside | 33,025 | 15,978 | 2,783 | 347 | 3,206 | 529 | 7,579 | 2,603 | 14,347 |
Soledad | 25,738 | 12,625 | 2,945 | 367 | 757 | 103 | 8,189 | 752 | 18,308 |
| Census-designated place | Total Population | White | African American | Native American | Asian | Pacific Islander | other races | two or more races | Hispanic or Latino (of any race) |
Aromas‡ | 1,358 | 1,026 | 7 | 24 | 35 | 1 | 194 | 71 | 511 |
Boronda | 1,710 | 661 | 10 | 26 | 116 | 7 | 774 | 116 | 1,457 |
Bradley | 93 | 85 | 0 | 2 | 0 | 0 | 5 | 1 | 11 |
Carmel Valley Village | 4,407 | 4,044 | 21 | 22 | 70 | 11 | 120 | 119 | 328 |
Castroville | 6,481 | 2,807 | 96 | 96 | 169 | 9 | 2,955 | 349 | 5,841 |
Chualar | 1,190 | 337 | 1 | 2 | 11 | 0 | 827 | 12 | 1,151 |
Del Monte Forest | 4,514 | 3,922 | 43 | 10 | 388 | 3 | 57 | 91 | 167 |
Elkhorn | 1,565 | 1,122 | 9 | 7 | 63 | 3 | 286 | 75 | 588 |
Las Lomas | 3,024 | 1,167 | 37 | 93 | 53 | 24 | 1,490 | 160 | 2,696 |
Lockwood | 379 | 297 | 4 | 6 | 2 | 0 | 56 | 14 | 100 |
Moss Landing | 204 | 149 | 7 | 1 | 2 | 1 | 30 | 14 | 46 |
Pajaro | 3,070 | 1,451 | 15 | 78 | 53 | 0 | 1,281 | 192 | 2,889 |
Pine Canyon | 1,822 | 1,173 | 29 | 15 | 18 | 0 | 490 | 97 | 984 |
Prunedale | 17,560 | 11,771 | 177 | 199 | 672 | 58 | 3,639 | 1,044 | 7,322 |
San Ardo | 517 | 252 | 1 | 3 | 5 | 0 | 245 | 11 | 363 |
San Lucas | 269 | 113 | 0 | 4 | 6 | 0 | 127 | 19 | 224 |
Spreckels | 673 | 483 | 0 | 13 | 26 | 0 | 130 | 21 | 193 |
| Unincorporated communities | Total Population | White | African American | Native American | Asian | Pacific Islander | other races | two or more races | Hispanic or Latino (of any race) |
| All others not CDPs (combined) | 51,377 | 38,253 | 690 | 522 | 2,365 | 114 | 7,281 | 2,152 | 14,949 |
| ‡ Note: these numbers reflect only the portion of this CDP in Monterey County | |||||||||
2000
As of the census[27] of 2000, there were 401,762 people, 121,236 households, and 87,896 families residing in the county. The population density was 121 people per square mile (47/km2). There were 131,708 housing units at an average density of 40 per square mile (15/km2). The racial makeup of the county was 55.9% White, 3.8% Black or African American, 1.1% Native American, 6.0% Asian, 0.5% Pacific Islander, 27.8% from other races, and 5.0% from two or more races. 46.79% of the population were Hispanic or Latino of any race. 6.3% were of German and 5.4% English ancestry according to Census 2000. 52.9% spoke English, 39.6% Spanish and 1.6% Tagalog as their first language.
There were 121,236 households out of which 39.1% had children under the age of 18 living with them, 56.0% were married couples living together, 11.6% had a female householder with no husband present, and 27.5% were non-families. 21.2% of all households were made up of individuals and 8.2% had someone living alone who was 65 years of age or older. The average household size was 3.14 and the average family size was 3.65.
In the county, the population was spread out with 28.4% under the age of 18, 10.9% from 18 to 24, 31.4% from 25 to 44, 19.3% from 45 to 64, and 10.0% who were 65 years of age or older. The median age was 32 years. For every 100 female residents there were 107.3 male residents. For every 100 female residents age 18 and over, there were 107.7 male residents.
The median income for a household in the county was $48,305, and the median income for a family was $51,169. Men had a median income of $38,444 versus $30,036 for women. The per capita income for the county was $20,165. About 9.7% of families and 13.5% of the population were below the poverty line, including 17.4% of those under age 18 and 6.8% of those age 65 or over.
Government
At the local level, Monterey County is governed by the Monterey County Board of Supervisors. Like all governing bodies in California, the Monterey County Board of Supervisors is empowered with both legislative and executive authority over the entirety of Monterey County and is the primary governing body for all unincorporated areas within the County boundaries. The Board has five elected members, each of whom represents one of five districts. Taken together, the five districts comprise the entirety of the county.[28]
Current board members:
Luis Alejo - 1st District- John Phillips - 2nd District
Simon Salinas - 3rd District- Jane Parker - 4th District (current board chair)
- Mary Adams - 5th District
The Board conducts its meetings in the county seat, Salinas, and is a member of the regional governmental agency, the Association of Monterey Bay Area Governments.[29][30]
Supervisorial Districts
Supervisorial district boundaries are divided roughly equally according to population, using data from the most recent census.[31] In addition, any redistricting changes must comply with both California law as well as the federal Voting Rights Act.[31] Boundaries are adjusted decennially based on data reported by the United States Census Bureau for the most recent census.[31]
District 1
The 1st District is geographically the smallest supervisorial district in Monterey County and is entirely within the city limits of the city of Salinas.[28][32]
Luis Alejo represents the 1st District on the Board of Supervisors.[33] His current term expires in January 2021.
District 2
As the northernmost supervisorial district in Monterey County, the 2nd District includes the communities of Boronda, Castroville, Las Lomas, Moss Landing, Pajaro, Prunedale, Royal Oaks, the northern neighborhoods of the city of Salinas, and those portions of the community of Aromas that are located within Monterey County.[28][34]
John Phillips is currently the Supervisor for the 2nd District.[35] His current term ends in January 2019.[28]
District 3
The 3rd District covers the majority of the Salinas Valley and southern Monterey County, extending to its border with San Luis Obispo County. The district includes the unincorporated communities of Spreckels, Chualar, and Jolon; the eastern portion of the city of Salinas; the cities of Gonzales, Greenfield, Soledad, and King City; the military installations at Fort Hunter Liggett and Camp Roberts; and portions of the Los Padres National Forest.[28][36]
The 3rd District is represented by Simon Salinas.[37] His current term ends in January 2019.[28]
District 4
The 4th District includes the southwest portion of the city of Salinas, the cities of Del Rey Oaks, Marina, Seaside, Sand City, and the former military installation at Fort Ord.[28][38]
Jane Parker currently holds the seat for 4th District Supervisor.[39] Her current term ends in January 2017.[28][40]
District 5
The 5th District is geographically the largest of the five supervisorial districts, and covers most of the Monterey Peninsula and southern coastline of Monterey County down to the southern county border with San Luis Obispo County. The 5th District includes the cities of Carmel-by-the-Sea, Monterey, and Pacific Grove; the unincorporated communities of Carmel Valley, Big Sur, Pebble Beach, San Benancio, Corral de Tierra, and Jamesburg; military installations at the Presidio of Monterey, the Defense Language Institute, and the Naval Postgraduate School; and the Ventana Wilderness area of the Los Padres National Forest.[28][41][42]
Mary L. Adams is currently the 5th District Supervisor.[28] Her current term ends in January 2021.[28]
State and federal Representatives
In the United States House of Representatives, Monterey County is part of California's 20th congressional district, represented by Democrat Jimmy Panetta.[43]
In the California State Assembly, Monterey County is split between the 29th Assembly District, represented by Democrat Mark Stone, and the 30th Assembly District, represented by Democrat Robert Rivas.[44]
In the California State Senate, Monterey County is split between the 12th Senate District, represented by Democrat Anna Caballero, and the 17th Senate District, represented by Democrat Bill Monning.[45]
Politics
Voter registration
| Population and registered voters | ||
|---|---|---|
| Total population[15] | 411,385 | |
| Registered voters[46][note 3] | 168,245 | 40.9% |
| Democratic[46] | 87,040 | 51.7% |
| Republican[46] | 40,721 | 24.2% |
| Democratic–Republican spread[46] | +46,319 | +27.5% |
| Independent[46] | 3,927 | 2.3% |
| Green[46] | 1,129 | 0.7% |
| Libertarian[46] | 852 | 0.5% |
| Peace and Freedom[46] | 392 | 0.2% |
| Americans Elect[46] | 12 | 0.0% |
| Other[46] | 241 | 0.1% |
| No party preference[46] | 33,931 | 20.2% |
Cities by population and voter registration
| Cities by population and voter registration | |||||||
|---|---|---|---|---|---|---|---|
| City | Population[15] | Registered voters[46] [note 3] | Democratic[46] | Republican[46] | D–R spread[46] | Other[46] | No party preference[46] |
| Carmel-by-the-Sea | 3,728 | 74.8% | 40.5% | 33.6% | +6.9% | 8.8% | 20.4% |
| Del Rey Oaks | 1,734 | 65.1% | 47.9% | 26.4% | +21.5% | 6.6% | 21.8% |
| Gonzales | 8,074 | 34.6% | 66.8% | 14.0% | +52.8% | 5.4% | 15.9% |
| Greenfield | 15,864 | 26.3% | 70.3% | 11.6% | +58.7% | 3.3% | 16.0% |
| King City | 12,629 | 21.6% | 58.7% | 22.6% | +36.1% | 4.1% | 16.2% |
| Marina | 19,636 | 46.4% | 48.2% | 21.8% | +26.4% | 7.9% | 25.1% |
| Monterey | 27,861 | 49.8% | 47.4% | 24.6% | +22.8% | 7.1% | 23.4% |
| Pacific Grove | 14,995 | 64.0% | 49.1% | 23.6% | +25.5% | 7.6% | 22.3% |
| Salinas | 148,780 | 34.1% | 60.2% | 18.8% | +41.4% | 4.6% | 18.2% |
| Sand City | 292 | 51.0% | 37.6% | 24.8% | +12.8% | 14.1% | 29.5% |
| Seaside | 32,735 | 35.6% | 54.1% | 18.9% | +35.2% | 6.7% | 22.9% |
| Soledad | 25,548 | 19.5% | 67.9% | 11.4% | +56.5% | 4.0% | 18.1% |
Overview
For most of the 20th century, Monterey County was a Republican stronghold in presidential elections. From 1900 until 1992, the only Democrats to carry the county were Woodrow Wilson, Franklin Roosevelt, and Lyndon Johnson. Since 1992, the county has become a Democratic stronghold in Presidential and congressional elections, with George H.W. Bush in 1988 being the last Republican to win Monterey County.
| Year | GOP | DEM | Others |
|---|---|---|---|
2016 | 26.16% 34,895 | 66.78% 89,088 | 7.07% 9,425 |
2012 | 30.27% 37,390 | 67.13% 82,920 | 2.60% 3,208 |
2008 | 29.89% 38,797 | 68.15% 88,453 | 1.95% 2,533 |
2004 | 38.38% 47,838 | 60.36% 75,241 | 1.26% 1,574 |
2000 | 37.23% 43,761 | 57.53% 67,618 | 5.23% 6,155 |
1996 | 36.66% 39,794 | 53.15% 57,700 | 10.19% 11,064 |
1992 | 31.25% 36,461 | 47.01% 54,861 | 21.74% 25,367 |
1988 | 49.83% 50,022 | 48.81% 48,998 | 1.36% 1,361 |
1984 | 57.16% 55,710 | 41.79% 40,733 | 1.05% 1,027 |
1980 | 54.67% 47,452 | 33.51% 29,086 | 11.82% 10,256 |
1976 | 51.02% 40,896 | 45.97% 36,849 | 3.00% 2,408 |
1972 | 57.04% 47,004 | 39.49% 32,545 | 3.47% 2,859 |
1968 | 50.16% 33,670 | 42.10% 28,261 | 7.74% 5,193 |
1964 | 37.90% 24,579 | 61.83% 40,093 | 0.27% 172 |
1960 | 56.26% 33,428 | 43.43% 25,805 | 0.30% 180 |
1956 | 59.54% 29,514 | 40.21% 19,932 | 0.26% 127 |
1952 | 62.51% 30,578 | 36.90% 18,051 | 0.58% 286 |
1948 | 50.59% 17,233 | 46.10% 15,704 | 3.31% 1,126 |
1944 | 45.82% 12,246 | 53.66% 14,342 | 0.52% 140 |
1940 | 44.01% 11,810 | 55.00% 14,758 | 0.99% 265 |
1936 | 37.70% 7,565 | 61.13% 12,267 | 1.17% 235 |
1932 | 39.37% 6,200 | 56.77% 8,942 | 3.86% 608 |
1928 | 63.12% 7,228 | 36.13% 4,138 | 0.75% 86 |
1924 | 61.07% 4,744 | 11.41% 886 | 27.53% 2,138 |
1920 | 67.76% 4,817 | 24.91% 1,771 | 7.33% 521 |
1916 | 44.81% 3,599 | 48.28% 3,878 | 6.91% 555 |
1912 | 0.01% 1 | 46.26% 3,392 | 53.72% 3,939 |
1908 | 53.64% 2,486 | 34.87% 1,616 | 11.50% 533 |
1904 | 59.17% 2,453 | 34.13% 1,415 | 6.71% 278 |
1900 | 50.10% 1,964 | 46.56% 1,825 | 3.34% 131 |
1896 | 45.82% 1,878 | 52.43% 2,149 | 1.76% 72 |
1892 | 41.65% 1,709 | 39.14% 1,606 | 19.21% 788 |
According to the California Secretary of State, as of April 2008, Monterey County has 147,066 registered voters.[citation needed] Of those voters, 72,550 (49.3%) are registered Democratic, 42,744 (29.1%) are registered Republican, 5,488 (3.7%) are registered with other political parties, and 26,284 (17.9%) declined to state a political party. Except for Sand City, all of the other cities, towns, and the unincorporated area of Monterey County have more individuals registered with the Democratic Party than the Republican Party. In Sand City, the Republicans have the advantage by 1 voter.
In August 2018, it adopted a flag designed by a Nob Hill resident.[48]
Crime
The following table includes the number of incidents reported and the rate per 1,000 persons for each type of offense.
| Population and crime rates | ||
|---|---|---|
| Population[15] | 411,385 | |
| Violent crime[49] | 2,118 | 5.15 |
| Homicide[49] | 51 | 0.12 |
| Forcible rape[49] | 125 | 0.30 |
| Robbery[49] | 657 | 1.60 |
| Aggravated assault[49] | 1,285 | 3.12 |
| Property crime[49] | 6,885 | 16.74 |
| Burglary[49] | 3,151 | 7.66 |
| Larceny-theft[49][50] | 6,245 | 15.18 |
| Motor vehicle theft[49] | 1,808 | 4.39 |
| Arson[49] | 90 | 0.22 |
Cities by population and crime rates
| Cities by population and crime rates | ||||||||
|---|---|---|---|---|---|---|---|---|
| City | Population[51] | Violent crimes[51] | Violent crime rate per 1,000 persons | Property crimes[51] | Property crime rate per 1,000 persons | |||
| Carmel | 3,822 | 7 | 1.83 | 99 | 25.90 | |||
| Del Rey Oaks | 1,668 | 2 | 1.20 | 37 | 22.18 | |||
| Gonzales | 8,404 | 36 | 4.28 | 102 | 12.14 | |||
| Greenfield | 16,765 | 120 | 7.16 | 306 | 18.25 | |||
| King City | 13,214 | 54 | 4.09 | 332 | 25.12 | |||
| Marina | 30,227 | 191 | 6.03 | 1,347 | 24.62 | |||
| Monterey | 28,508 | 153 | 5.37 | 1,016 | 35.64 | |||
| Pacific Grove | 15,437 | 27 | 1.75 | 249 | 16.13 | |||
| Salinas | 154,413 | 1,027 | 6.65 | 4,906 | 31.77 | |||
| Sand City | 343 | 7 | 20.41 | 76 | 221.57 | |||
| Seaside | 33,887 | 109 | 3.22 | 499 | 14.73 | |||
| Soledad | 26,253 | 80 | 3.05 | 284 | 10.82 | |||
Media
Television service for the community comes from the Monterey-Salinas-Santa Cruz designated market area (DMA). Radio stations Monterey-Salinas-Santa Cruz area of dominant influence (ADI) or continuous measurement market (CMM). Local newspapers include the Monterey County Herald, Monterey County Weekly, Salinas Californian and the Carmel Pine Cone.
Home prices
As of December 2005, Monterey County ranked among America's ten most expensive counties, with Santa Barbara County topping the list with a median home price of $753,790. In Monterey County, the median home price was $699,900. In the northern, more densely populated part in the county, the median home price was even higher, at $712,500, making it the fourth most expensive housing market in California. The disparity between the median household income of roughly $48,305 and the median home price of $700k has been cause for recent concern over excluding potential home buyers from the market. The end of the United States housing bubble has caused prices to drop substantially, with median home prices having fallen to $280,000 as at September 2008.[52]
Transportation
Major highways
 U.S. Route 101
 State Route 1
 State Route 68
 State Route 146
 State Route 156
 State Route 183
 State Route 198
| Wikinews has related news: French tourists killed in California bus rollover accident |
Public transportation
Monterey County is served by Amtrak trains and Greyhound Lines buses.
Monterey-Salinas Transit provides transit service throughout most of Monterey County, with buses to Big Sur and King City as well as in Monterey, Salinas and Carmel. MST also runs service to San Jose, California in Santa Clara County
Airports
Monterey Regional Airport is located just east of the city of Monterey, California. Commercial flights are available.
Marina Municipal Airport is located in the city of Marina, California.
Salinas Municipal Airport is located in the city of Salinas, California.
Communities
Cities
- Carmel-by-the-Sea
- Del Rey Oaks
- Gonzales
- Greenfield
- King City
- Marina
- Monterey
- Pacific Grove
Salinas (county seat)- Sand City
- Seaside
- Soledad
Census-designated places
- Aromas
- Boronda
- Bradley
- Carmel Valley Village
- Castroville
- Chualar
Del Monte Forest, includes the well-known community of Pebble Beach- Elkhorn
- Las Lomas
- Lockwood
- Moss Landing
- Pajaro
- Pine Canyon
- Prunedale
- San Ardo
- San Lucas
- Spreckels
Unincorporated communities
- Ambler Park
- Bryson
- Carmel Highlands
- Corral de Tierra
- Gorda
- Jamesburg
- Jolon
- Lucia
- Millers Ranch
- Notleys Landing
- Old Hilltown
- Pacific Grove Acres
- Parkfield
- Plaskett
- Posts
- Robles Del Rio
- San Benancio
- Slates Hot Springs
- Springtown
- Sycamore Flat
- Tassajara Hot Springs
- White Rock
Other places
- Big Sur
- Laguna Seca Ranch
Fort Ord decommissioned in the 1990s, some of it was converted to California State University, Monterey Bay- Naval Postgraduate School
- Fort Hunter Liggett
Presidio of Monterey, home to the Defense Language Institute and one of three presidios in California
Jacks Peak Park, including the highest point on the Monterey Peninsula
Population ranking
The population ranking of the following table is based on the 2010 census of Monterey County.[53]
† county seat
| Rank | City/Town/etc. | Municipal type | Population (2010 Census) |
|---|---|---|---|
| 1 | † Salinas | City | 150,441 |
| 2 | Seaside | City | 33,025 |
| 3 | Monterey | City | 27,810 |
| 4 | Soledad | City | 25,738 |
| 5 | Marina | City | 19,718 |
| 6 | Prunedale | CDP | 17,560 |
| 7 | Greenfield | City | 16,330 |
| 8 | Pacific Grove | City | 15,041 |
| 9 | King City | City | 12,874 |
| 10 | Gonzales | City | 8,187 |
| 11 | Castroville | CDP | 6,481 |
| 12 | Del Monte Forest | CDP | 4,514 |
| 13 | Carmel Valley Village | CDP | 4,407 |
| 14 | Carmel-by-the-Sea | City | 3,722 |
| 15 | Pajaro | CDP | 3,070 |
| 16 | Las Lomas | CDP | 3,024 |
| 17 | Aromas (partially in San Benito County) | CDP | 2,650 |
| 18 | Pine Canyon | CDP | 1,822 |
| 19 | Boronda | CDP | 1,710 |
| 20 | Del Rey Oaks | City | 1,624 |
| 21 | Elkhorn | CDP | 1,565 |
| 22 | Chualar | CDP | 1,190 |
| 23 | Spreckels | CDP | 673 |
| 24 | San Ardo | CDP | 517 |
| 25 | Lockwood | CDP | 379 |
| 26 | Sand City | City | 334 |
| 27 | San Lucas | CDP | 269 |
| 28 | Moss Landing | CDP | 204 |
| 29 | Bradley | CDP | 93 |
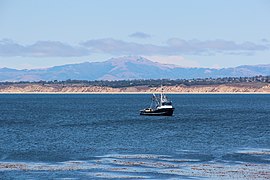
Gallery
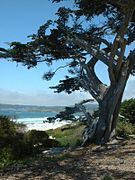
Big Sur - Midcounty coastline with the McWay Rocks in foreground
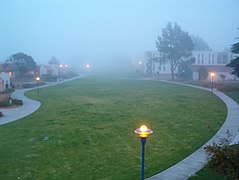
California State University at Monterey Bay
Carmel-by-the-Sea - Beach scene
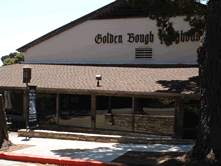
Carmel-by-the-Sea - Golden Bough Playhouse

Carmel-by-the-Sea - Forest Theater

Castroville - Main entrance to the city

Gonzales - Water tower
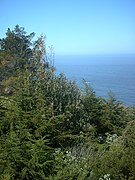
Gorda, California - A view of the Pacific Ocean
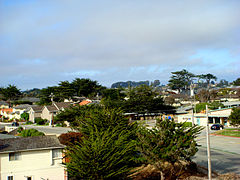
Marina neighborhood

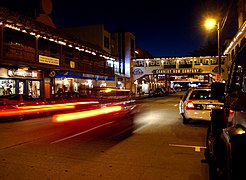
Main Street - Salinas

Monterey - Monterey Bay Aquarium
Monterey - Cannery Row

Monterey - Fisherman's Wharf

Monterey - Commercial Wharf
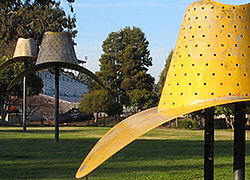
Hat in three stages of landing by Claes Oldemburg - Salinas
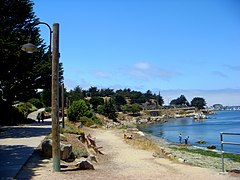
Monterey - Beachside recreational trail

Monterey - Scuba diving lessons in Monterey Bay
Monterey - Fremont Peak, viewed from the Monterey Bay Aquarium
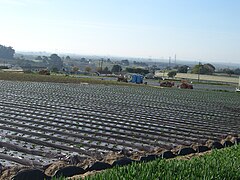
Monterey County - Strawberry fields in rural area

Lapis Road looking south

Junipero Serra Peak, highest point in the county
Salinas - John Steinbeck's former home
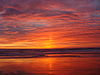
Marina Sunset

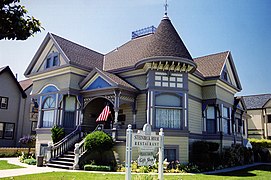
Monterey - Colton Hall
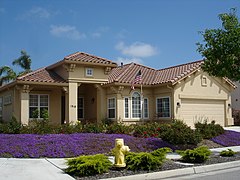
Salinas - Newer Spanish-Revival style house in Harden Ranch

Salinas - An average 1,400 sq ft (130 m2) home in North Salinas

Salinas - Residential neighborhood at Harden Ranch, Salinas

Salinas - Downtown

Salinas - National Steinbeck Center

Agricultural fields in the Salinas Valley
Steinbeck House - Salinas

Soledad - Mission Nuestra Senora de la Soledad


See also
- Coastal California
- List of museums in the California Central Coast
- List of school districts in Monterey County, California
- National Register of Historic Places listings in Monterey County, California
- Monterey County attractions
- Fort Hunter Liggett
Notes
^ Other = Some other race + Two or more races
^ Native American = Native Hawaiian or other Pacific Islander + American Indian or Alaska Native
^ ab Percentage of registered voters with respect to total population. Percentages of party members with respect to registered voters follow.
References
^ "Chronology". California State Association of Counties. Retrieved February 6, 2015..mw-parser-output cite.citationfont-style:inherit.mw-parser-output .citation qquotes:"""""""'""'".mw-parser-output .citation .cs1-lock-free abackground:url("//upload.wikimedia.org/wikipedia/commons/thumb/6/65/Lock-green.svg/9px-Lock-green.svg.png")no-repeat;background-position:right .1em center.mw-parser-output .citation .cs1-lock-limited a,.mw-parser-output .citation .cs1-lock-registration abackground:url("//upload.wikimedia.org/wikipedia/commons/thumb/d/d6/Lock-gray-alt-2.svg/9px-Lock-gray-alt-2.svg.png")no-repeat;background-position:right .1em center.mw-parser-output .citation .cs1-lock-subscription abackground:url("//upload.wikimedia.org/wikipedia/commons/thumb/a/aa/Lock-red-alt-2.svg/9px-Lock-red-alt-2.svg.png")no-repeat;background-position:right .1em center.mw-parser-output .cs1-subscription,.mw-parser-output .cs1-registrationcolor:#555.mw-parser-output .cs1-subscription span,.mw-parser-output .cs1-registration spanborder-bottom:1px dotted;cursor:help.mw-parser-output .cs1-ws-icon abackground:url("//upload.wikimedia.org/wikipedia/commons/thumb/4/4c/Wikisource-logo.svg/12px-Wikisource-logo.svg.png")no-repeat;background-position:right .1em center.mw-parser-output code.cs1-codecolor:inherit;background:inherit;border:inherit;padding:inherit.mw-parser-output .cs1-hidden-errordisplay:none;font-size:100%.mw-parser-output .cs1-visible-errorfont-size:100%.mw-parser-output .cs1-maintdisplay:none;color:#33aa33;margin-left:0.3em.mw-parser-output .cs1-subscription,.mw-parser-output .cs1-registration,.mw-parser-output .cs1-formatfont-size:95%.mw-parser-output .cs1-kern-left,.mw-parser-output .cs1-kern-wl-leftpadding-left:0.2em.mw-parser-output .cs1-kern-right,.mw-parser-output .cs1-kern-wl-rightpadding-right:0.2em
^ "Junipero Serra Peak". Peakbagger.com. Retrieved March 16, 2015.
^ "American Fact Finder - Results". United States Census Bureau. Retrieved April 7, 2015.
^ ab "Population and Housing Unit Estimates". Retrieved June 9, 2017.
^ ab "State & County QuickFacts". United States Census Bureau. Retrieved April 4, 2016.
^ "Find a County". National Association of Counties. Retrieved 2011-06-07.
^ Gudde, Erwin G. (1949). California Place Names. Berkeley, Calif.: University of California Press. p. 222. ASIN B000FMOPP4.
^ "2010 Census Gazetteer Files". United States Census Bureau. August 22, 2012. Retrieved September 28, 2015.
^ Bureau, U.S. Census. "American FactFinder - Results". factfinder.census.gov. Retrieved 2016-06-14.
^ abc "MEDIAN HOUSEHOLD INCOME IN THE PAST 12 MONTHS (IN 2013 INFLATION-ADJUSTED DOLLARS)". American Fact Finder. U.S Census Bureau. Retrieved 27 December 2014.
^ abcde "MEDIAN HOUSEHOLD INCOME IN THE PAST 12 MONTHS (IN 2013 INFLATION-ADJUSTED DOLLARS)". American Fact Finder. U.S. Census Bureau. Retrieved 26 December 2014.
^ ab "EDUCATIONAL ATTAINMENT FOR THE POPULATION 25 YEARS AND OVER". American Fact Finder. U.S. Census Bureau. Retrieved 26 December 2014.
^ ab "POVERTY STATUS IN THE PAST 12 MONTHS BY HOUSEHOLD TYPE BY AGE OF HOUSEHOLDER". American Fact Finder. U.S. Census Bureau. Retrieved 26 December 2014.
^ ab "Map Index". American Fact Finder. U.S. Census Bureau. Retrieved 26 December 2014.
^ abcdefghijklmnopq U.S. Census Bureau. American Community Survey, 2011 American Community Survey 5-Year Estimates, Table B02001. American FactFinder. Retrieved 2013-10-26.
^ ab U.S. Census Bureau. American Community Survey, 2011 American Community Survey 5-Year Estimates, Table B03003. American FactFinder. Retrieved 2013-10-26.
^ ab U.S. Census Bureau. American Community Survey, 2011 American Community Survey 5-Year Estimates, Table B19301. American FactFinder. Retrieved 2013-10-21.
^ ab U.S. Census Bureau. American Community Survey, 2011 American Community Survey 5-Year Estimates, Table B19013. American FactFinder. Retrieved 2013-10-21.
^ ab U.S. Census Bureau. American Community Survey, 2011 American Community Survey 5-Year Estimates, Table B19113. American FactFinder. Retrieved 2013-10-21.
^ ab U.S. Census Bureau. American Community Survey, 2011 American Community Survey 5-Year Estimates. American FactFinder. Retrieved 2013-10-21.
^ U.S. Census Bureau. American Community Survey, 2011 American Community Survey 5-Year Estimates, Table B01003. American FactFinder. Retrieved 2013-10-21.
^ "U.S. Decennial Census". United States Census Bureau. Retrieved September 28, 2015.
^ "Historical Census Browser". University of Virginia Library. Retrieved September 28, 2015.
^ Forstall, Richard L., ed. (March 27, 1995). "Population of Counties by Decennial Census: 1900 to 1990". United States Census Bureau. Retrieved September 28, 2015.
^ "Census 2000 PHC-T-4. Ranking Tables for Counties: 1990 and 2000" (PDF). United States Census Bureau. April 2, 2001. Retrieved September 28, 2015.
^ "2010 Census P.L. 94-171 Summary File Data". United States Census Bureau.
^ "American FactFinder". United States Census Bureau. Retrieved 2011-05-14.
^ abcdefghijk "Monterey County Supervisors and Their Districts". Board of Supervisors, County of Monterey. Retrieved 26 December 2018.
^ "Attend a Board Meeting". Board of Supervisors, County of Monterey. Retrieved September 21, 2012.
^ "AMBAG Board of Directors". Association of Monterey Bay Area Governments. Retrieved September 20, 2012.
^ abc "Districts and Redistricting, Monterey County Elections". Monterey County Elections Department. Retrieved September 21, 2012.
^ "Monterey County Supervisorial District 1 Map" (PDF). County of Monterey. Retrieved September 21, 2012.
^ "Monterey County 1st District Supervisor Luis Alejo". Board of Supervisors, County of Monterey. Retrieved 26 December 2018.
^ "Monterey County Supervisorial District 2 Map" (PDF). County of Monterey. Retrieved September 21, 2012.
^ "Monterey County 2nd District Supervisor Louis Calcagno". Board of Supervisors, County of Monterey. Archived from the original on October 1, 2012. Retrieved September 21, 2012.
^ "Monterey County Supervisorial District 3 Map" (PDF). County of Monterey. Retrieved September 21, 2012.
^ "Monterey County 3rd District Supervisor Simon Salinas". Board of Supervisors, County of Monterey. Retrieved September 21, 2012.
^ "Monterey County Supervisorial District 4 Map" (PDF). County of Monterey. Retrieved September 21, 2012.
^ "Jane Parker, Supervisor Fourth District". Board of Supervisors, County of Monterey. Retrieved September 21, 2012.
^ Rubin, Sara (June 7, 2012). "Vote for Oaks: Jane Parker sweeps District 4 re-election on the tide of Whispering Oaks reversal". Monterey County Weekly. Archived from the original on January 28, 2013. Retrieved October 12, 2012.
^ "Monterey County Supervisorial District 5 Map (North District 5)" (PDF). County of Monterey. Archived from the original (PDF) on July 1, 2012. Retrieved September 21, 2012.
^ "Monterey County Supervisorial District 5 Map (South District 5)" (PDF). County of Monterey. Archived from the original (PDF) on July 1, 2012. Retrieved September 21, 2012.
^ "California's 20th Congressional District - Representatives & District Map". Civic Impulse, LLC. Retrieved September 24, 2014.
^ "Communities of Interest - Counties". California Citizens Redistricting Commission. Retrieved September 24, 2014.
^ "Communities of Interest - Counties". California Citizens Redistricting Commission. Retrieved September 24, 2014.
^ abcdefghijklmnopq California Secretary of State. February 10, 2013 - Report of Registration Archived November 3, 2013, at the Wayback Machine. Retrieved 2013-10-31.
^ Leip, David. "Dave Leip's Atlas of U.S. Presidential Elections". uselectionatlas.org. Retrieved 2018-09-01.
^ Johnson, Jim (8 September 2018). "Monterey County gets first-ever flag as final design chosen". Monterey Herald. Retrieved 8 September 2018.
^ abcdefghij Office of the Attorney General, Department of Justice, State of California. Table 11: Crimes – 2009 Archived December 2, 2013, at the Wayback Machine. Retrieved 2013-11-14.
^ Only larceny-theft cases involving property over $400 in value are reported as property crimes.
^ abc United States Department of Justice, Federal Bureau of Investigation. Crime in the United States, 2012, Table 8 (California). Retrieved 2013-11-14.
^ "Mish's Global Economic Trend Analysis: C.A.R. Median Home Prices Down 47% From Peak". globaleconomicanalysis.blogspot.com.
^ "This site has been redesigned and relocated. - U.S. Census Bureau". Census.gov. Retrieved August 12, 2018.
External links
| Wikimedia Commons has media related to Monterey County, California. |
| Wikivoyage has a travel guide for Monterey County. |
Official website
- Monterey County Convention & Visitors Bureau
- Carmel Magazine: The Lifestyle Magazine of the Monterey Peninsula
Finding Aid to the Monterey County Miscellany, 1844-1850 at The Bancroft Library- Arts Council for Monterey County
Municipalities and communities of Monterey County, California, United States | ||
|---|---|---|
County seat: Salinas | ||
| Cities |
|  |
| CDPs |
| |
| Unincorporated communities |
| |
| Ghost towns |
| |
| Footnotes | ‡This populated place also has portions in an adjacent county | |
California Central Coast | ||
|---|---|---|
| Counties |
|  |
| Cities and towns 100k-250k |
| |
| Cities and towns 25k-100k |
| |
| Cities and towns 10k-25k |
| |
| Sub-regions |
| |
Counties in italics sometimes included in the definition of the Central Coast | ||
Sacramento (capital) | ||
| Topics |
|  |
| Regions |
| |
| Metro regions |
| |
| Counties |
| |
| Most populous cities |
| |
Coordinates: 36°14′N 121°19′W / 36.24°N 121.31°W / 36.24; -121.31
Authority control |
|
|---|


