Interglacial

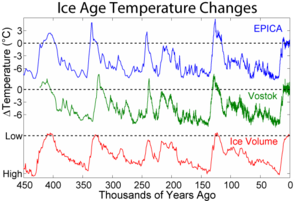
Shows the pattern of temperature and ice volume changes associated with recent glacials and interglacials
An interglacial period (or alternatively interglacial, interglaciation) is a geological interval of warmer global average temperature lasting thousands of years that separates consecutive glacial periods within an ice age. The current Holocene interglacial began at the end of the Pleistocene, about 11,700 years ago.
Contents
1 Interglacials during the Pleistocene
2 Interglacial optimum
3 See also
4 References
Interglacials during the Pleistocene
During the 2.5 million year span of the Pleistocene, numerous glacials, or significant advances of continental ice sheets in North America and Europe, have occurred at intervals of approximately 40,000 to 100,000 years. These long glacial periods were separated by more temperate and shorter interglacials.
During interglacials, such as the present one, the climate warms and the tundra recedes polewards following the ice sheets. Forests return to areas that once supported tundra vegetation. Interglacials are identified on land or in shallow epicontinental seas by their paleontology. Floral and faunal remains of species pointing to temperate climate and indicating a specific age are used to identify particular interglacials. Commonly used are mammalian and molluscan species, pollen and plant macro-remains (seeds and fruits). However, many other fossil remains may be helpful: insects, ostracods, foraminifera, diatoms, etc. Recently, ice cores and ocean sediment cores provide more quantitative and accurately dated evidence for temperatures and total ice volumes.
The interglacials and glacials coincide with cyclic changes in the Earth's orbit. Three orbital variations contribute to interglacials. The first is a change in the Earth's orbit around the sun, or eccentricity. The second is a shift in the tilt of the Earth's axis, the obliquity. The third is precession, or wobbling motion of Earth's axis.[1]
Warm summers in the Southern hemisphere occur when that hemisphere is tilted toward the sun and the Earth is nearest the sun in its elliptical orbit. Cool summers occur when the Earth is farthest from the sun during that season. These effects are more pronounced when the eccentricity of the orbit is large. When the obliquity is large, seasonal changes are more extreme.[2]
Interglacials are a useful tool for geological mapping and also for anthropologists, as they can be used as a dating method for hominid fossils.[3]
Brief periods of milder climate that occurred during the last glacial are called interstadials. Most (not all) interstadials are shorter than interglacials. Interstadial climate may have been relatively warm but this is not necessarily so. Because the colder periods (stadials) have often been very dry, wetter (so not necessarily warmer) periods have been registered in the sedimentary record as interstadials as well.
The oxygen isotope ratio obtained from seabed sediment core samples, a proxy for average global temperature, is an important source of information about changes in the climate of the earth.
Interglacial optimum
An interglacial optimum, or climatic optimum of an interglacial, is the period within an interglacial that experienced the most 'favourable' climate that occurred during that interglacial, often during the middle part. The climatic optimum of an interglacial follows, and is followed by, phases that are within the same interglacial and that experienced a less favourable climate (but nevertheless a 'better' climate than during the preceding/succeeding glacials).
During an interglacial optimum, sea levels rise to their highest values, but not necessarily exactly at the same time as the climatic optimum.
In the present interglacial, the Holocene, the climatic optimum occurred during the Subboreal (5 to 2.5 ka BP, which corresponds to 3000 BC–500 BC) and Atlanticum (9 to 5 ka, which corresponds to roughly 7000 BC–3000 BC). Our current climatic phase following this climatic optimum is still within the same interglacial (the Holocene). This warm period was followed by a gradual decline until about 2,000 years ago, with another warm period until the Little Ice Age (1250–1850).
The preceding interglacial optimum occurred during the Late Pleistocene Eemian Stage, 131–114 ka. During the Eemian the climatic optimum took place during pollen zone E4 in the type area (city of Amersfoort, Netherlands). Here this zone is characterized by the expansion of Quercus (oak), Corylus (hazel), Taxus (yew), Ulmus (elm), Fraxinus (ash), Carpinus (hornbeam), and Picea (spruce). During the Eemian Stage sea level was about 8 meters higher than today and the water temperature of the North Sea was about 2 °C higher than at present.
See also
- Greenhouse and icehouse Earth
- Milankovitch cycles
- Snowball Earth
Interstadial periods- Last glacial maximum
- Timeline of glaciation
References
^ Eldredge, S. "Ice Ages – What are they and what causes them?". Utah Geological Survey. Retrieved 2 March 2013..mw-parser-output cite.citationfont-style:inherit.mw-parser-output qquotes:"""""""'""'".mw-parser-output code.cs1-codecolor:inherit;background:inherit;border:inherit;padding:inherit.mw-parser-output .cs1-lock-free abackground:url("//upload.wikimedia.org/wikipedia/commons/thumb/6/65/Lock-green.svg/9px-Lock-green.svg.png")no-repeat;background-position:right .1em center.mw-parser-output .cs1-lock-limited a,.mw-parser-output .cs1-lock-registration abackground:url("//upload.wikimedia.org/wikipedia/commons/thumb/d/d6/Lock-gray-alt-2.svg/9px-Lock-gray-alt-2.svg.png")no-repeat;background-position:right .1em center.mw-parser-output .cs1-lock-subscription abackground:url("//upload.wikimedia.org/wikipedia/commons/thumb/a/aa/Lock-red-alt-2.svg/9px-Lock-red-alt-2.svg.png")no-repeat;background-position:right .1em center.mw-parser-output .cs1-subscription,.mw-parser-output .cs1-registrationcolor:#555.mw-parser-output .cs1-subscription span,.mw-parser-output .cs1-registration spanborder-bottom:1px dotted;cursor:help.mw-parser-output .cs1-hidden-errordisplay:none;font-size:100%.mw-parser-output .cs1-visible-errorfont-size:100%.mw-parser-output .cs1-subscription,.mw-parser-output .cs1-registration,.mw-parser-output .cs1-formatfont-size:95%.mw-parser-output .cs1-kern-left,.mw-parser-output .cs1-kern-wl-leftpadding-left:0.2em.mw-parser-output .cs1-kern-right,.mw-parser-output .cs1-kern-wl-rightpadding-right:0.2em
^ Rieke, G. "Long Term Climate".
^ Kottak, Conard Phillip (2005). Window on Humanity. New York: McGraw-Hill. ISBN 0-07-289028-2.